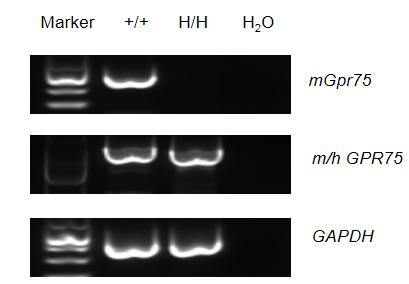
请输入关键字
请输入关键字
订购
*国家
中国
美国
中国香港
中国澳门
中国台湾
阿尔巴尼亚
阿尔及利亚
阿根廷
阿拉伯联合酋长国
阿鲁巴
阿曼
阿塞拜疆
阿森松岛
埃及
埃塞俄比亚
爱尔兰
爱沙尼亚
安道尔
安哥拉
安圭拉
安提瓜和巴布达
奥地利
奥兰群岛
澳大利亚
巴巴多斯
巴布亚新几内亚
巴哈马
巴基斯坦
巴拉圭
巴勒斯坦领土
巴林
巴拿马
巴西
白俄罗斯
百慕大
保加利亚
北马里亚纳群岛
贝宁
比利时
冰岛
波多黎各
波兰
波斯尼亚和黑塞哥维那
玻利维亚
伯利兹
博茨瓦纳
不丹
布基纳法索
布隆迪
朝鲜
赤道几内亚
丹麦
德国
迪戈加西亚岛
东帝汶
多哥
多米尼加共和国
多米尼克
俄罗斯
厄瓜多尔
厄立特里亚
法国
法罗群岛
法属波利尼西亚
法属圭亚那
法属南部领地
梵蒂冈
菲律宾
斐济
芬兰
佛得角
福克兰群岛
冈比亚
刚果(布)
刚果(金)
哥伦比亚
哥斯达黎加
格恩西岛
格林纳达
格陵兰
格鲁吉亚
古巴
瓜德罗普
关岛
圭亚那
哈萨克斯坦
海地
韩国
荷兰
荷属加勒比区
荷属圣马丁
黑山
洪都拉斯
基里巴斯
吉布提
吉尔吉斯斯坦
几内亚
几内亚比绍
加拿大
加纳
加纳利群岛
加蓬
柬埔寨
捷克
津巴布韦
喀麦隆
卡塔尔
开曼群岛
科科斯(基林)群岛
科摩罗
科索沃
科特迪瓦
科威特
克罗地亚
肯尼亚
库克群岛
库拉索
拉脱维亚
莱索托
老挝
黎巴嫩
立陶宛
利比里亚
利比亚
联合国
列支敦士登
留尼汪
卢森堡
卢旺达
罗马尼亚
马达加斯加
马恩岛
马尔代夫
马耳他
马拉维
马来西亚
马里
马其顿
马绍尔群岛
马提尼克
马约特
毛里求斯
毛里塔尼亚
美国本土外小岛屿
美属萨摩亚
美属维尔京群岛
蒙古
蒙特塞拉特
孟加拉国
秘鲁
密克罗尼西亚
缅甸
摩尔多瓦
摩洛哥
摩纳哥
莫桑比克
墨西哥
纳米比亚
南非
南极洲
南乔治亚和南桑威奇群岛
南苏丹
瑙鲁
尼加拉瓜
尼泊尔
尼日尔
尼日利亚
纽埃
挪威
诺福克岛
帕劳
皮特凯恩群岛
葡萄牙
日本
瑞典
瑞士
萨尔瓦多
萨摩亚
塞尔维亚
塞拉利昂
塞内加尔
塞浦路斯
塞舌尔
沙特阿拉伯
圣巴泰勒米
圣诞岛
圣多美和普林西比
圣赫勒拿
圣基茨和尼维斯
圣卢西亚
圣马丁岛
圣马力诺
圣皮埃尔和密克隆群岛
圣文森特和格林纳丁斯
斯里兰卡
斯洛伐克
斯洛文尼亚
斯瓦尔巴和扬马延
斯威士兰
苏丹
苏里南
所罗门群岛
索马里
塔吉克斯坦
泰国
坦桑尼亚
汤加
特克斯和凯科斯群岛
特里斯坦-达库尼亚群岛
特立尼达和多巴哥
突尼斯
图瓦卢
土耳其
土库曼斯坦
托克劳
瓦利斯和富图纳
瓦努阿图
危地马拉
委内瑞拉
文莱
乌干达
乌克兰
乌拉圭
乌兹别克斯坦
希腊
西班牙
西撒哈拉
新加坡
新喀里多尼亚
新西兰
匈牙利
休达及梅利利亚
叙利亚
牙买加
亚美尼亚
也门
伊拉克
伊朗
以色列
意大利
印度
印度尼西亚
英国
英属维尔京群岛
英属印度洋领地
约旦
越南
赞比亚
泽西岛
乍得
直布罗陀
智利
中非共和国
*省份
*城市
*姓名
*电话
*单位
*职位
*邮箱
*请输入验证码
*验证码
B-hGPR75 mice
Strain Name
 C57BL/6JNifdc-Gpr75tm1(GPR75)Bcgen/Bcgen
Common Name  B-hGPR75 mice
Background C57BL/6JNifdc Catalog number 112305
Aliases 
GPRchr2, WI31133
mRNA expression analysis

from clipboard


Strain specific analysis of GPR75 gene expression in wild-type C57BL/6 mice and B-hGPR75 mice by RT-PCR. Mouse GPR75 mRNA was detectable in brain of wild-type C57BL/6 mice, GPR75 mRNA was detectable in brain of wild-type C57BL/6 mice and homozygous B-hGPR75 mice (H/H) due to the high genetic similarity, and we sequenced and confirmed that the replaced region of homozygous B-hGPR75 mice (H/H) is the human GPR75 sequence.


mRNA expression analysis


from clipboard


Strain specific analysis of GPR75 gene expression in B-hGPR75 mice by RT-qPCR. After high-fat diet (HFD) induction, the expression of GPR75 mRNA in  brain tends to decrease compared to mice on a standard diet (Chow), but there is no significant difference.

Weight gain during high-fat diet and metabolic phenotype in B-hGPR75 mice 

from clipboard


Weight gain during high-fat diet and metabolic phenotype in male B-hGPR75 mice. (A) Biweekly body weight gain during a 10-week high-fat diet (HFD) challenge. (B) Changes in fasting blood glucose after the high-fat diet challenge. (C) Results of a glucose tolerance test at the end of the 10-week high-fat diet challenge. (D) Area under the cueve (AUC) for the IPGTT. (E) Results of an insulin tolerance test at the end of the 10-week high-fat diet challenge. (F) Area under the curve (AUC) for the ITT. Results are presented as mean ±SEM. Abbreviations: ns, not statistically significant; *P < 0.05, **P < 0.01, ***P < 0.001, ****P < 0.0001.
There were no differences in weight gaining and metabolic phenotype between C57BL/6 mice and homozygous B-hGPR75 mice.

Blood-biochemistry of high-fat diet in B-hGPR75 mice 

from clipboard


Blood biochemistry tests of B-hGPR75 mice. Serum from the male C57BL/6, homozygous B-hGPR75 mice and homozygous B-Gpr75 KO mice (n=8) was collected and analyzed for levels of ALT and AST. There were no significant differences in ALT and AST levels between groups. After a high-fat diet, the level of TC significantly increased, except for homozygous B-Gpr75 KO mice, the TG levels did not change much in other groups. Values are expressed as mean ± SEM. Abbreviations: ns, not statistically significant; *P < 0.05, **P < 0.01, ***P < 0.001, ****P < 0.0001.

Body fat content and liver coefficient of high-fat diet in B-hGPR75 mice 

from clipboard


Body fat content and liver coefficient of high-fat diet in B-hGPR75 mice. After 10 weeks of high-fat induction in male C57BL/6, B-hGPR75 mice and B-Gpr75 KO mice (n=8), the epididymal adipose tissue, inguinal adipose tissue, and liver were weighed. The weight of fat in C57BL/6 and B-hGPR75 mice after high-fat induction was significantly higher than that in the Chow group. There was no significant difference in these indicators after high-fat induction in B-Gpr75 mice. Values are expressed as mean ± SEM. Abbreviations: ns, not statistically significant; *P < 0.05, **P < 0.01, ***P < 0.001, ****P < 0.0001.