
C57BL/6-Tfrctm1(TFRC)Bcgen/Bcgen • 110861
Background:
Validation:
Application:
Gene targeting strategy for B-hTFR1 mice. The exons 4-19 of mouse Tfr1 gene that encode extracellular domain are replaced by human counterparts in B-hTFR1 mice. The genomic region of mouse Tfr1 gene that encodes cytoplasmic portion is retained. The promoter, 5’UTR and 3’UTR region of the mouse gene are also retained. The chimeric TFR1 expression is driven by endogenous mouse Tfr1 promoter, while mouse Tfr1 gene transcription and translation will be disrupted.
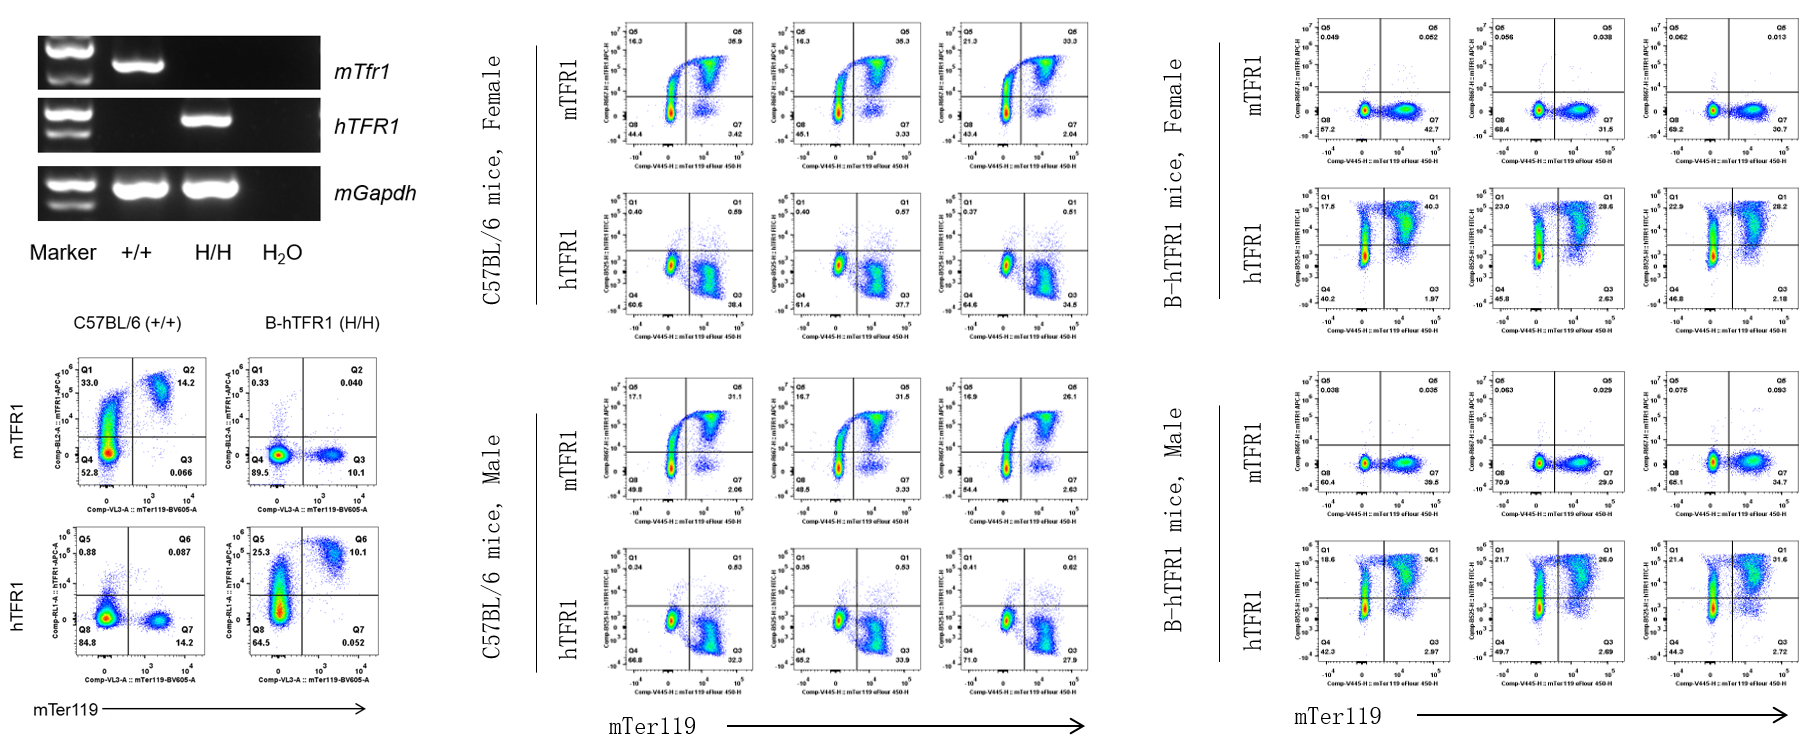
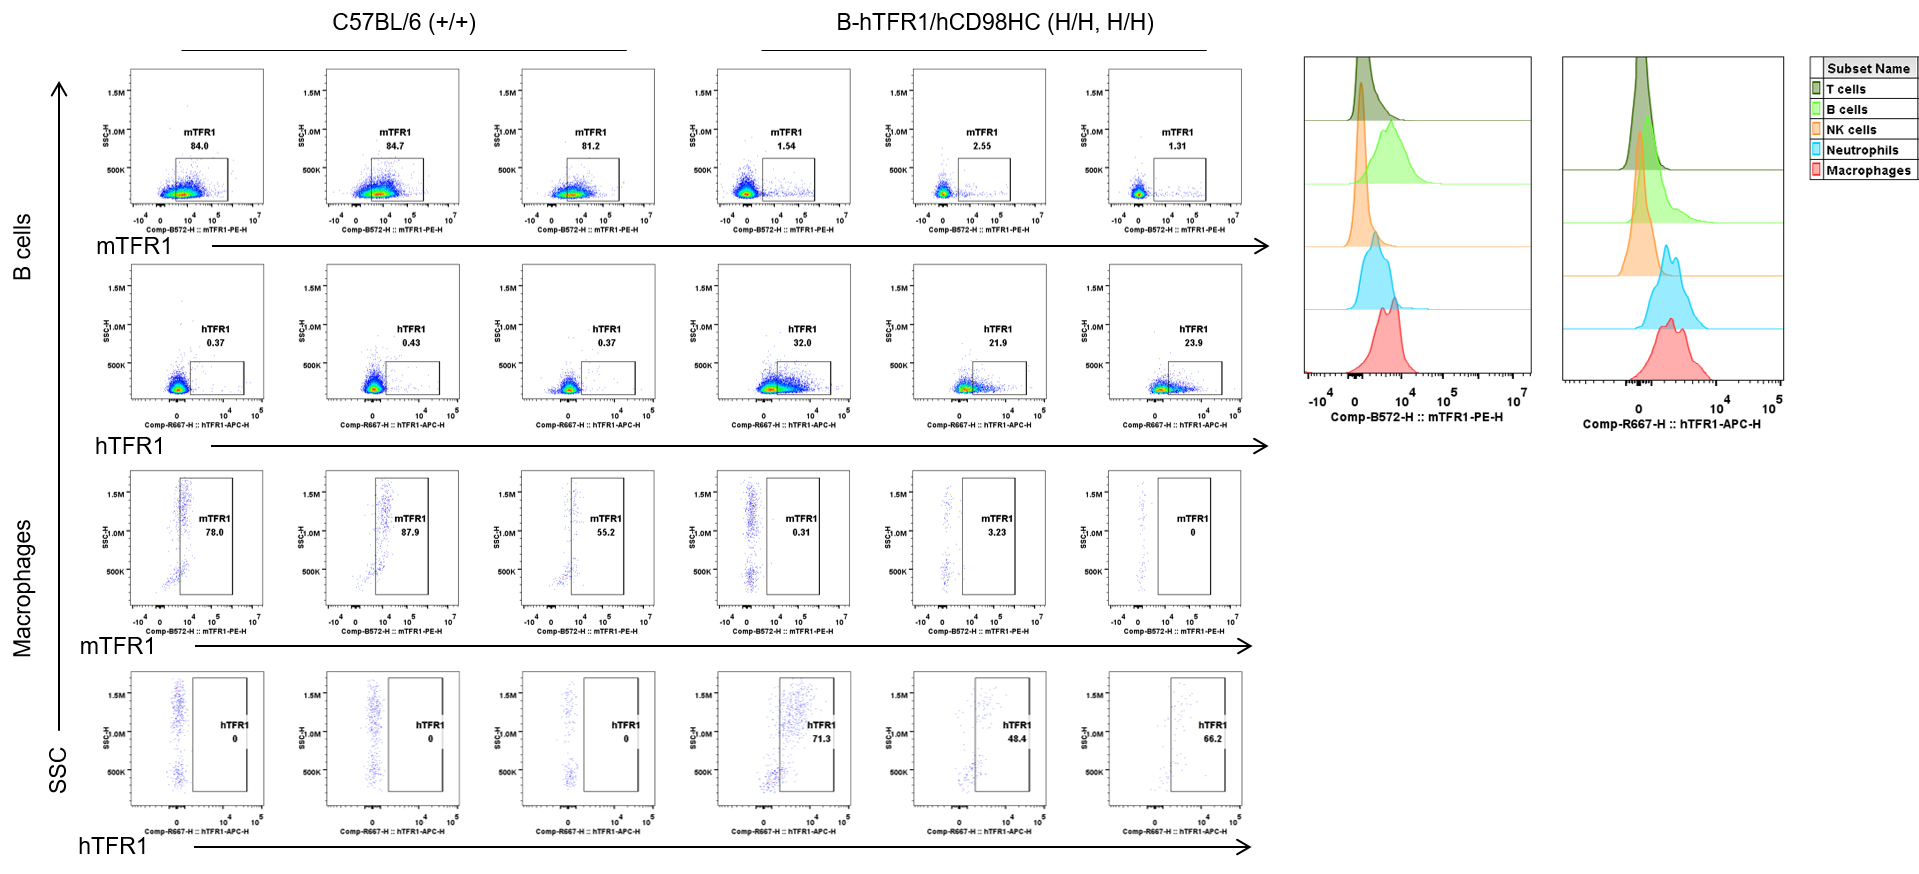
Strain specific TFR1 expression analysis in wild-type C57BL/6 and homozygous B-hTFR1/hCD98HC mice by flow cytometry. Blood cells were collected from wild-type C57BL/6 (+/+) and homozygous B-hTFR1/hCD98HC mice (H/H, H/H) and analyzed by flow cytometry with anti-mouse TFR1 antibody (Biolegend, 113808) and anti-human TFR1 antibody (Biolegend, 334108). mTFR1 was only detectable in wild-type mice, and hTFR1 was exclusively detectable in B cells and macrophages from homozygous mice but not from wild-type mice.
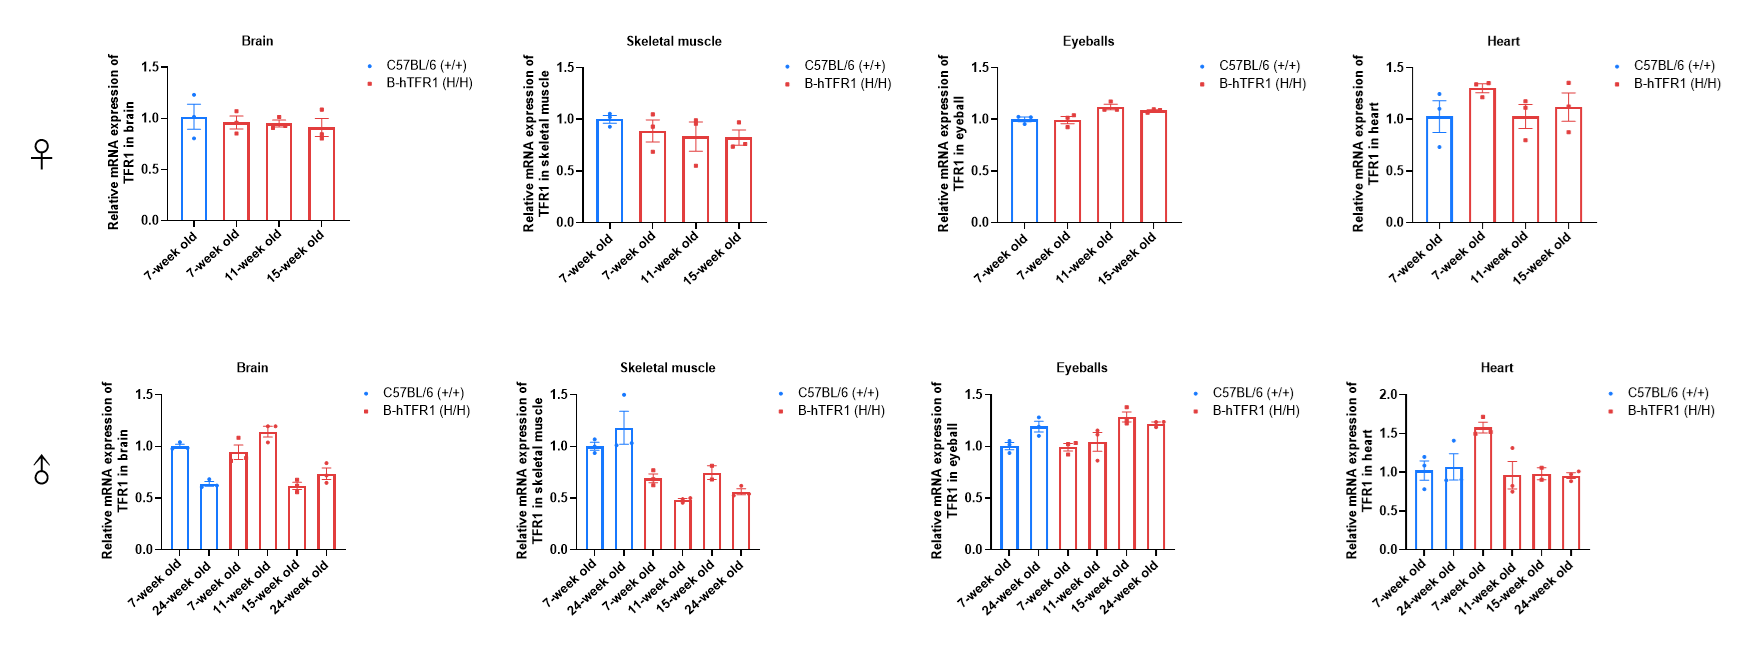
TFR1 mRNA expression analysis in homozygous B-hTFR1 mice. Brain (A), skeletal muscle (B), eyeball (C) and heart (D) RNA were isolated from wild-type C57BL/6 mice (+/+) (female, 7-week-old, n=3; male, 7-week-old and 24-week-old, n=3) and homozygous B-hTFR1 mice (H/H) (female, 7-week-old, 11-week-old, 15-week-old, n=3; male, 7-week-old, 11-week-old, 15-week-old, 24-week-old, n=3) ), then cDNA libraries were synthesized by reverse transcription, followed by PCR with TFR1 primers. Values are expressed as mean ± SEM.
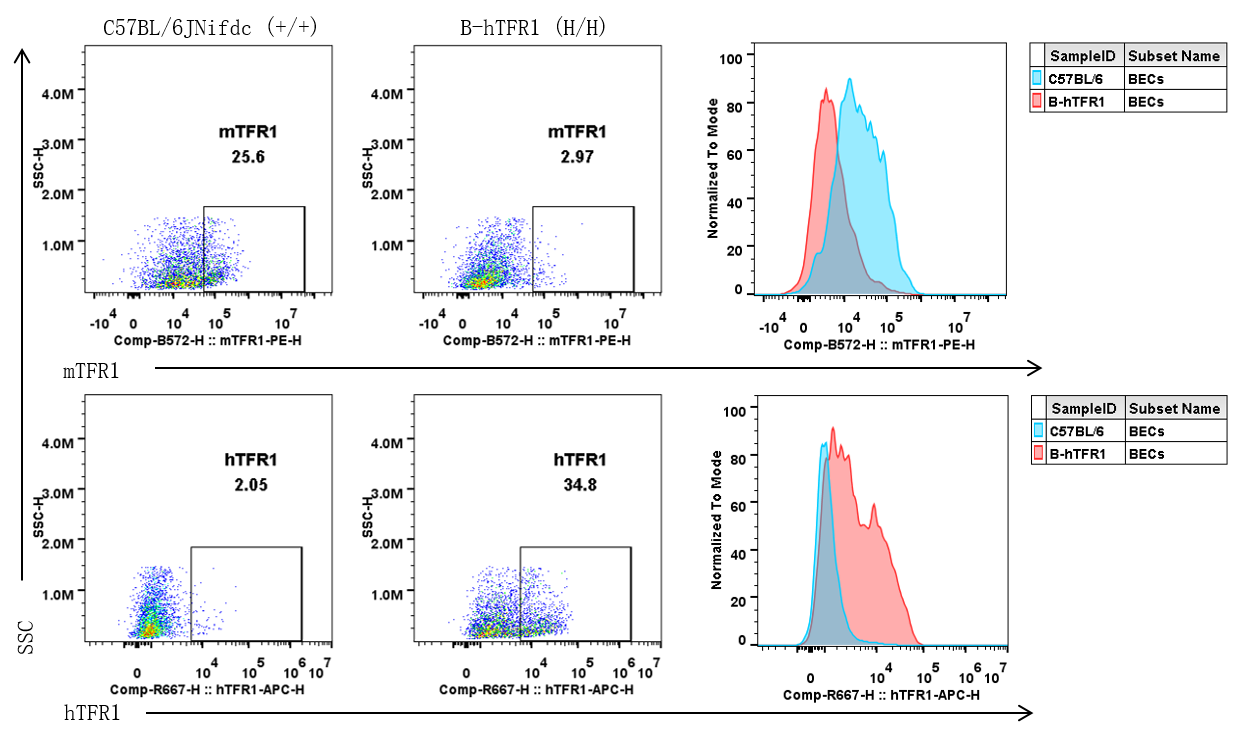
Strain specific TFR1 expression analysis in wild-type C57BL/6JNifdc and homozygous B-hTFR1 mice by flow cytometry. Brain cells were collected from wild-type C57BL/6JNifdc (+/+) and homozygous B-hTFR1 mice (H/H), and analyzed by flow cytometry with anti-mouse TFR1 antibody (Biolegend, 113808) and anti-human TFR1 antibody (Biolegend, 334108).
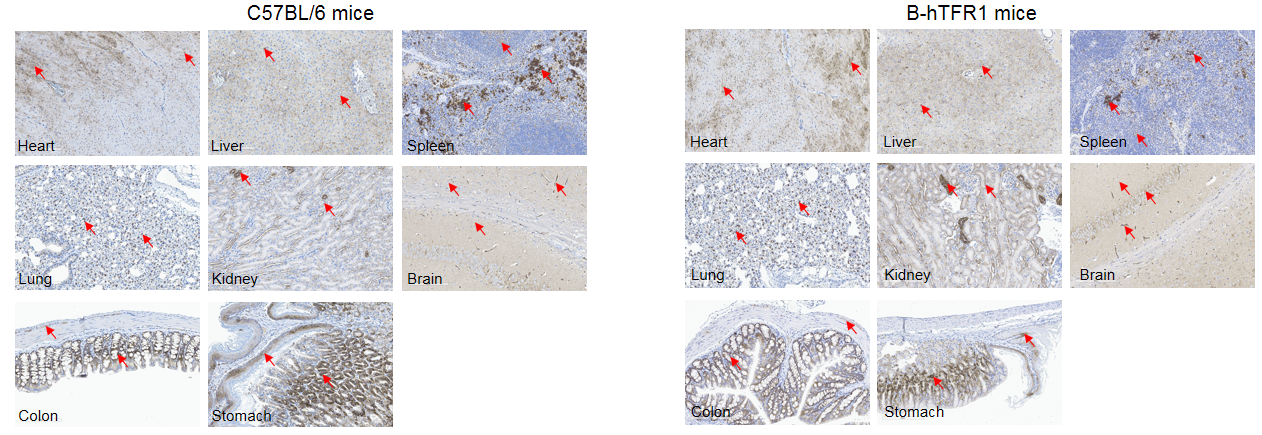
Human TFR1 was detected in the heart, liver, spleen, lung, kidney, brain, colon and stomach of B-hTFR1 mice, which is similar to the expression pattern of mouse TFR1 in wild-type C57BL/6 mice. Red arrow: positive cells expressing TFR1.
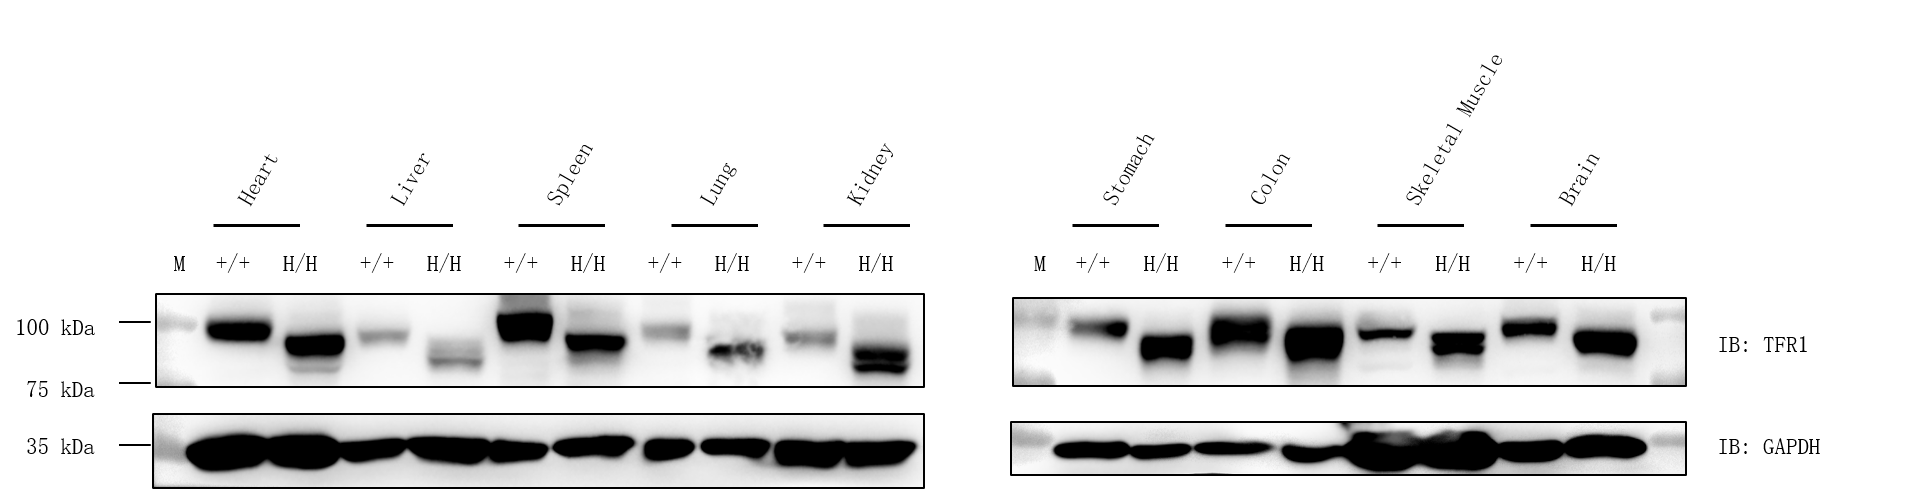
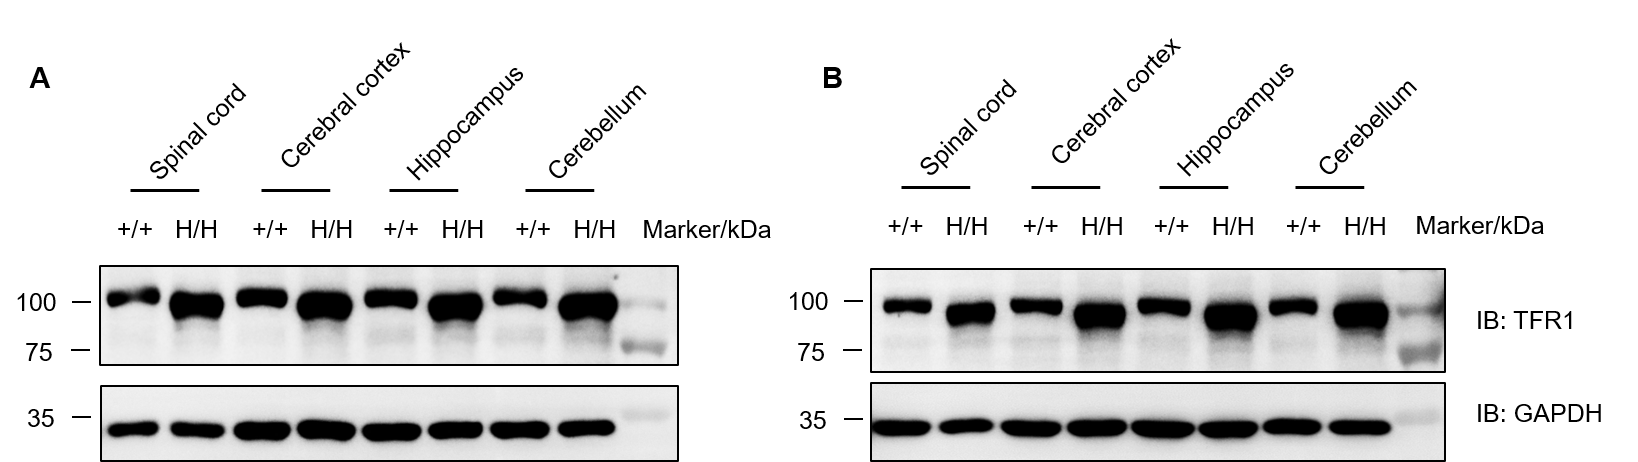
Western blot analysis of TFR1 protein expression in wild-type C57BL/6JNidc mice and homozygous B-hTFR1 mice by WB. Various tissues were collected from wild-type C57BL/6JNifdc mice (+/+) and homozygous B-hTFR1 mice (H/H), and then analyzed by western blot with anti-TFR1 antibody (abcam, ab214039). 40 μg total proteins were loaded for western blotting analysis. GAPDH were detected as internal control. TFR1 was detectable in heart, liver, spleen, lung, kidney, stomach, colon, muscle and brain from both C57BL/6JNifdc and homozygous B-hTFR1 mice, as the antibody was cross-reactive between human and mouse. M, marker.
Protein expression analysis of TFR1 in homozygous B-hTFR1/hCD98HC mice. Various tissue lysates were collected from wild-type C57BL/6JNifdc mice (+/+) and homozygous B-hTFR1/hCD98HC mice (H/H), and then analyzed by western blot with anti-transferrin receptor antibody (abcam, ab214039). 40 μg total protein was loaded for western blotting analysis. (A) Male. (B) Female.
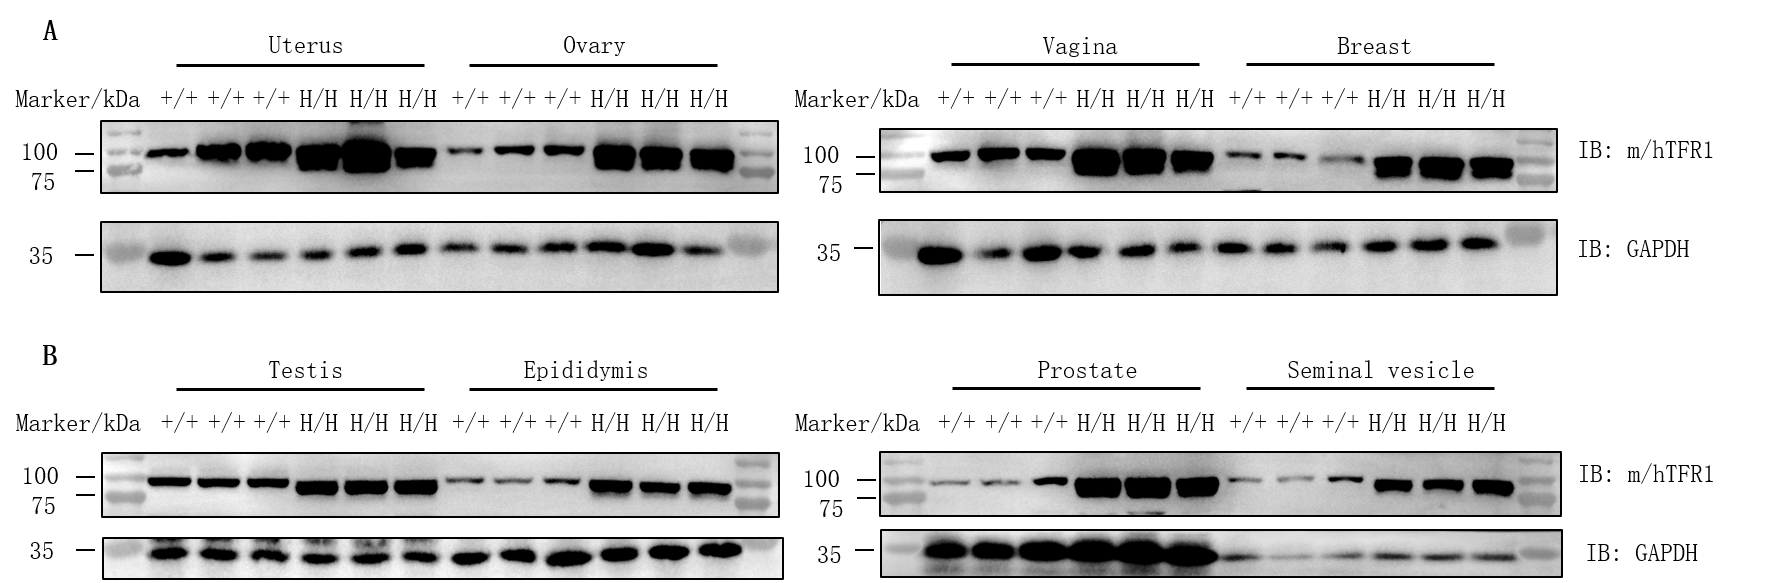
Protein expression analysis of TFR1 in homozygous B-hTFR1/hCD98HC mice. Various tissue lysates were collected from wild-type C57BL/6JNifdc mice (+/+) and homozygous B-hTFR1/hCD98HC mice (H/H), and then analyzed by western blot with anti-transferrin receptor antibody (abcam, ab214039) and anti-CD98 antibody (abcam, ab307587). 30 μg total proteins were loaded for western blotting analysis. TFR1 was detected in uterus, ovary, vagina, breast, testis, epididymis, prostate and seminal vesicle from both wild-type C57BL/6JNifdc mice and homozygous B-hTFR1/hCD98HC mice, as the antibody was cross-reactive between human and mouse.
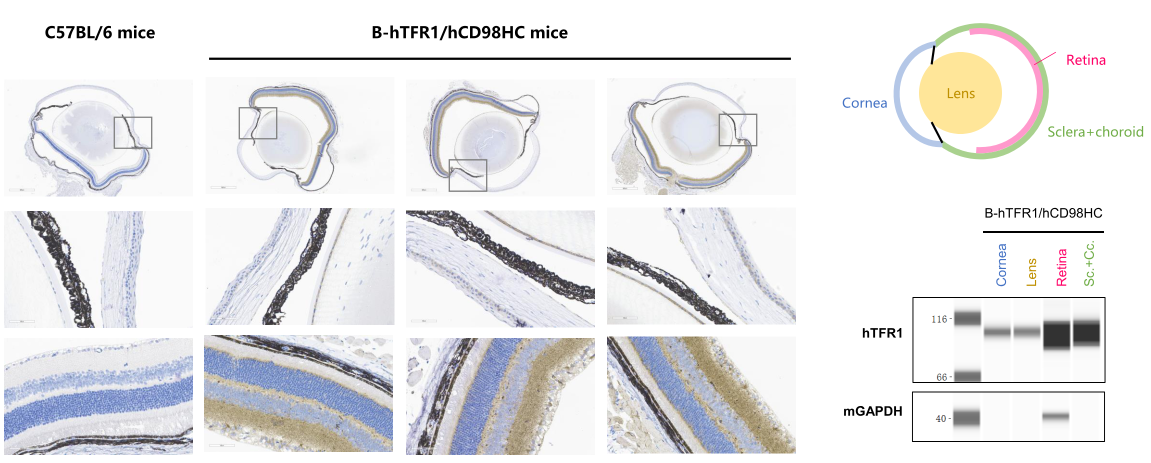
TFR1 expression analysis in eyeball. The expression of human TFR1 was observed in corneal epithelial cells, endothelial cells, and lens epithelial cells, while it was highly expressed in the retina in B-hTFR1/hCD98HC mice, but not in wild-type C57BL/6 mice.
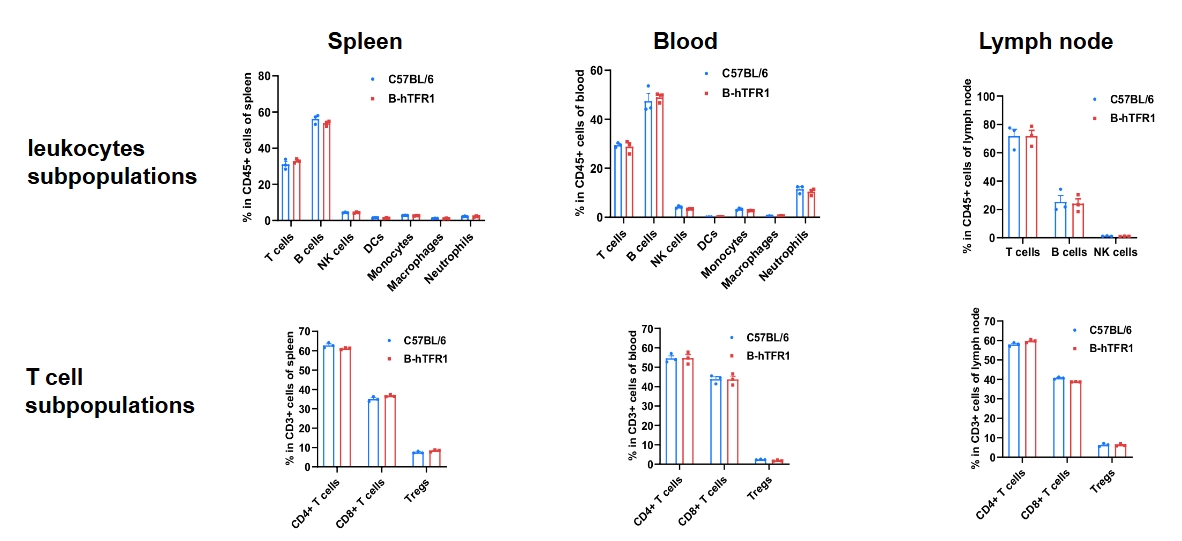
Humanization of TFR1 does not change the overall frequency or distribution of immune cell types in spleen, blood and lymph nodes. Values are expressed as mean ± SD.
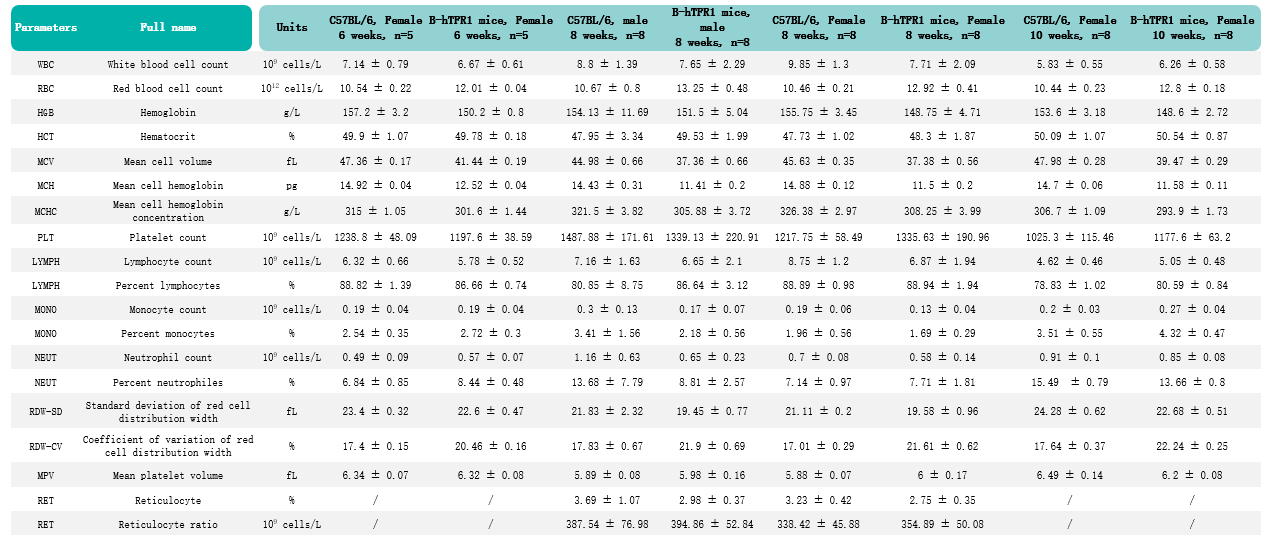
Humanization of TFR1 does not alter hematological. Values are expressed as mean ± SD.

Serum iron homeostasis assay in wild-type C57BL/6JNifdc and homozygous humanized B-hTFR1 mice. Serum were collected from C57BL/6JNifdc (female, n=3; male, n=3; 14-week-old) and B-hTFR1 mice (female, n=3; male, n=3; 9-week-old), and then analyzed by Total Iron-Binding Capacity (TIBC) and Serum Iron Assay kit (abcam, ab239715). (A) Serum transferrin-bound iron levels, (B) TIBC (Total Iron-Binding Capacity), (C) UIBC (Unsaturated Iron-Binding Capacity) and (D) transferrin saturation in homozygous B-hTFR1 mice were similar to those in the wild-type C57BL/6JNifdc mice. B-hTFR1 mice show no significant differences in iron homeostasis compared to wild-type C57BL/6JNifdc mice. Values are expressed as mean ± SEM. Significance was determined by two-way ANOVA test. *P < 0.05, **P < 0.01, ***p < 0.0001.

Serum iron homeostasis assay in wild-type C57BL/6JNifdc and homozygous humanized B-hTFR1 mice. (A) For serum total iron detection, serum were collected from C57BL/6 and B-hTFR1 mice (n=3, 6 week old, female), and then analyzed by Iron Assay Kit (abcam, ab83366). (B) For mouse ferritin and (C) transferrin detection, serum were collected from C57BL/6 and B-hTFR1 mice (n=3, 8 week old, male), and then analyzed by ELISA with anti-mouse ferritin ELISA kit (Abcam, ab157713) and anti-mouse Transferrin ELISA kit (abcam, ab157724). Serum total iron levels, ferritin and transferrin levels in homozygous B-hTFR1 mice were similar to those in the wild-type C57BL/6 mice. B-hTFR1 mice show no significant differences in iron homeostasis compared to wild-type C57BL/6JNifdc mice. Values are expressed as mean ± SEM. Significance was determined by two-way ANOVA test. *P < 0.05, **P < 0.01, ***p < 0.0001.
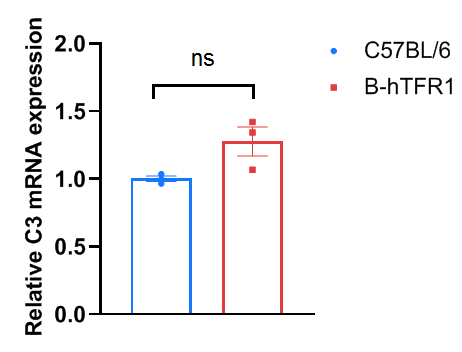
Liver complement component 3 levels in wild-type C57BL/6 and homozygous TFR1 humanized mice. Liver were collected from C57BL/6 and TFR1 humanized mice (n=3, 6 week old, female), then cDNA libraries were synthesized by reverse transcription, followed by qPCR with mouse complement component 3 primers. The mRNA expression of mouse complement component 3 in homozygous TFR1 humanized mice was similar to those in the wild-type C57BL/6 mice. Values are expressed as mean ± SEM. Significance was determined by unpaired t-test. *P < 0.05, **P < 0.01, ***P < 0.001.
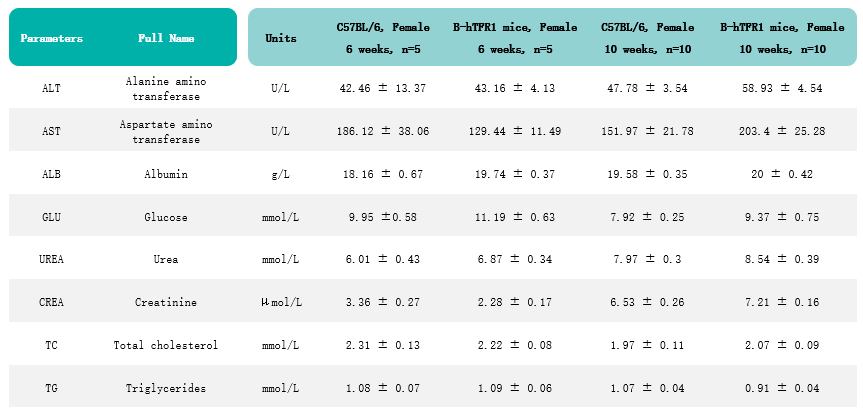
Humanization of TFR1 does not alter various blood biochemical parameters. Values are expressed as mean ± SD.
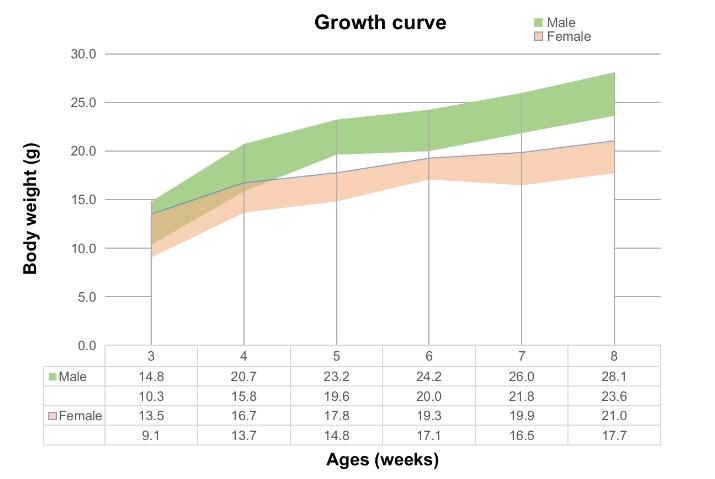
Growth curve of TFR1 humanized mice. Select mice aged 3 to 8 weeks, and randomly sample and weigh 50 males and 50 females from each age group. The minimum and maximum weights of the mice in the table are calculated as the average ± SD. The growth curve follows a normal distribution, with a 68% probability that random errors fall within the ± SD range.
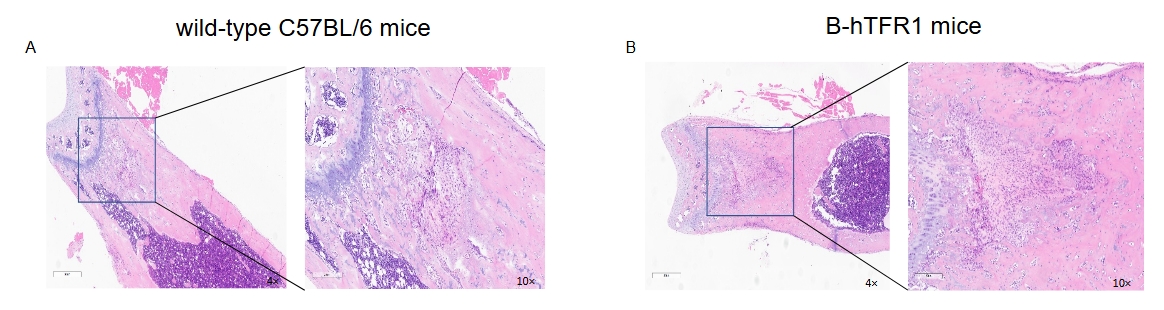
No abnormalities were found in the bone marrow of femurs from wild-type C57BL/6 mice (A) and B-hTFR1 mice (B).
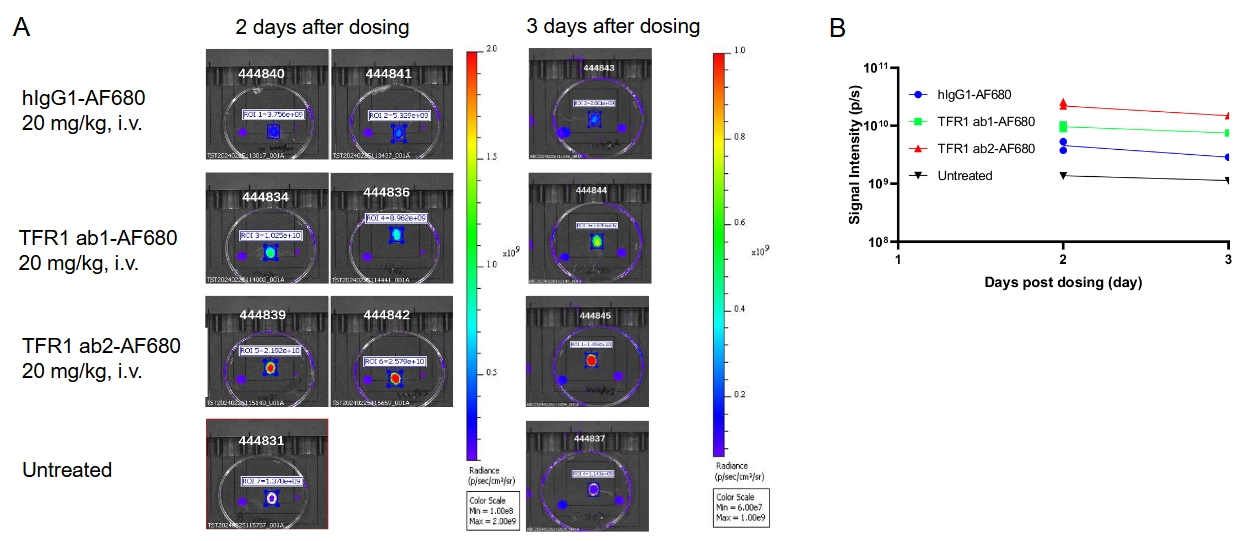
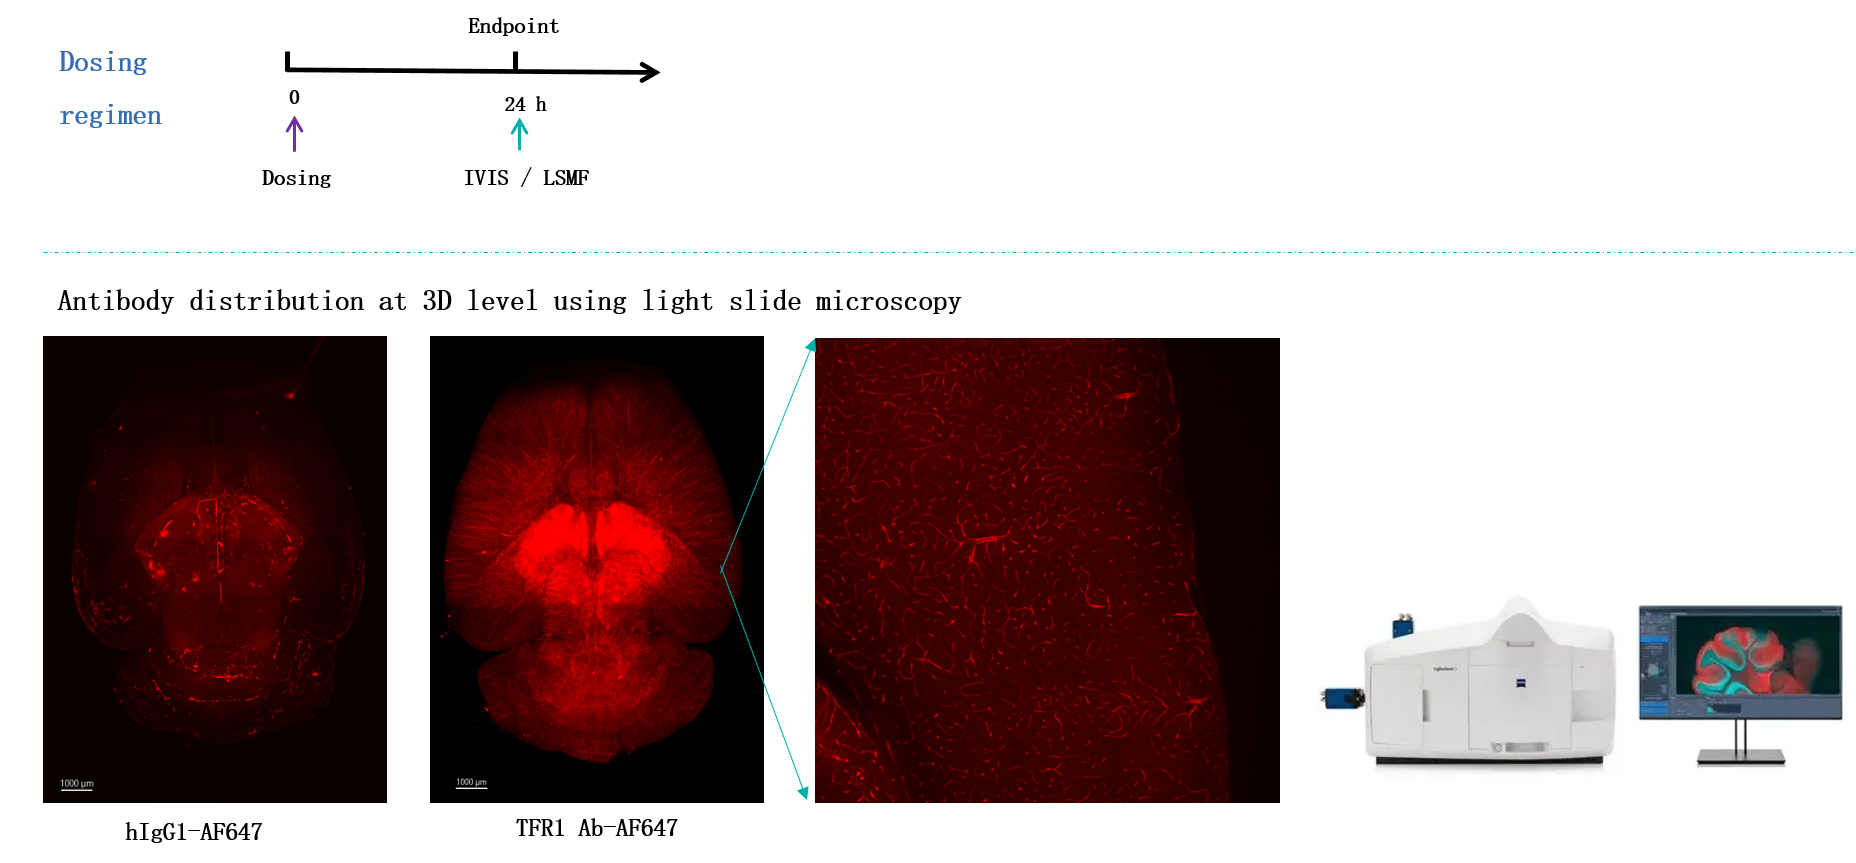
B-hTFR1 mice were intravenously injected with AF680-conjugated control hIgG1 or anti human TFR1 antibodies ab1 and ab2 (provided by a client). After 2 days or 3 days post-injection, the mice were perfused and their brains were collected for analysis. (A) Mouse brain images under imaging system. (B) Fluorescence intensity of mouse brain under imaging system. The results indicate that the uptake of anti-human TFR1 antibody ab2 in the brain of B-hTFR1 mice was higher than that of anti-human TFR1 antibody ab1.
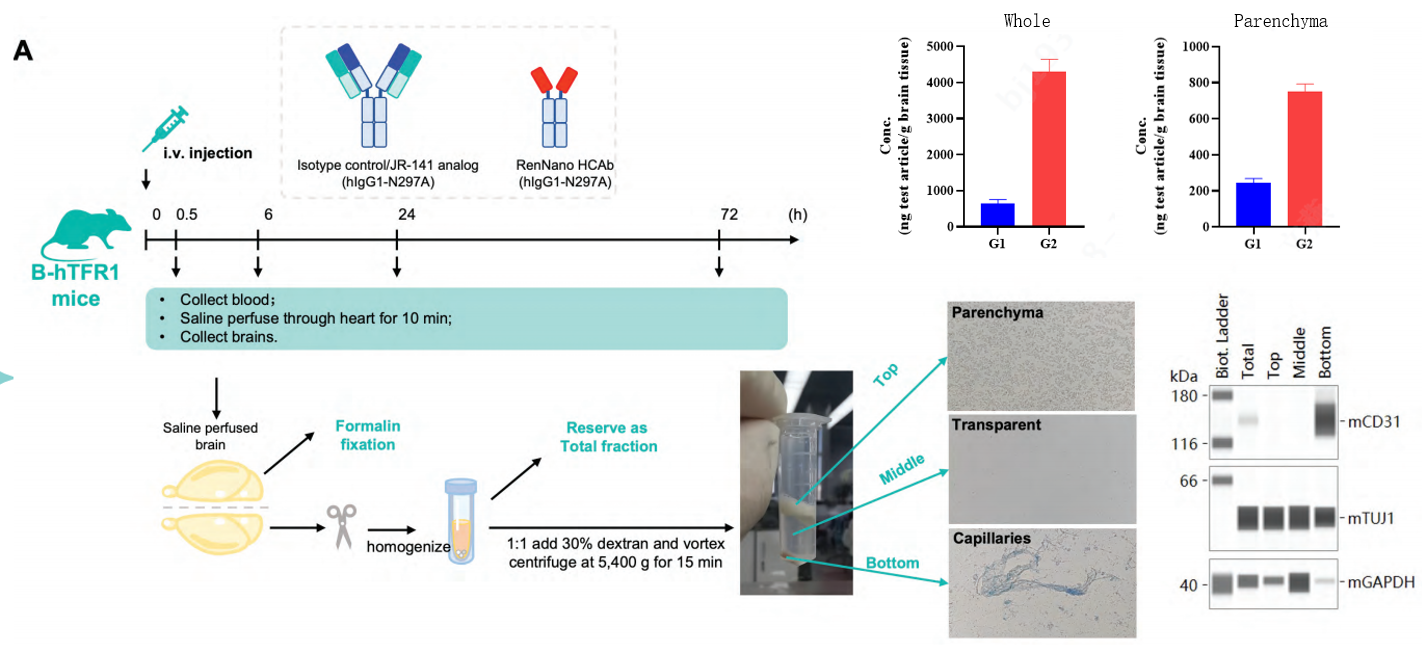
Anti-TFR1 HCAbs have the capacity to cross the BBB. (A). Humanized B-hTFR1mice were injected through tail veins with isotype control, JR-141 analog or RenNano-derived anti-TFR1 HCAbs (hlgG1). At 0.5, 6, 24 or 72 hours after exposure, serum was collected. At the endpoint, anesthetized mice were perfused by a saline injection through the left ventricle for 10mins. The right hemisphere of the brain was subjected to immunofluorescence, and the left was homogenized and subfractionated (via dextran addition and centrifugation) to detect hlgG concentration. The homogenate was separated into three layers. The top layer consisted of neurons; the middle layer was clear and cells were rarely observed: the bottom pellet consisted of fibrous structures which could contain blood vessels. Protein was extracted from each fraction and immunoblots were performed to detectmCD31 (endothelial cell specific marker),mTUJ1 (neuron specific marker) and mGAPDH abundance in each fraction, which demonstrated the successful separation of capillaries and parenchyma.
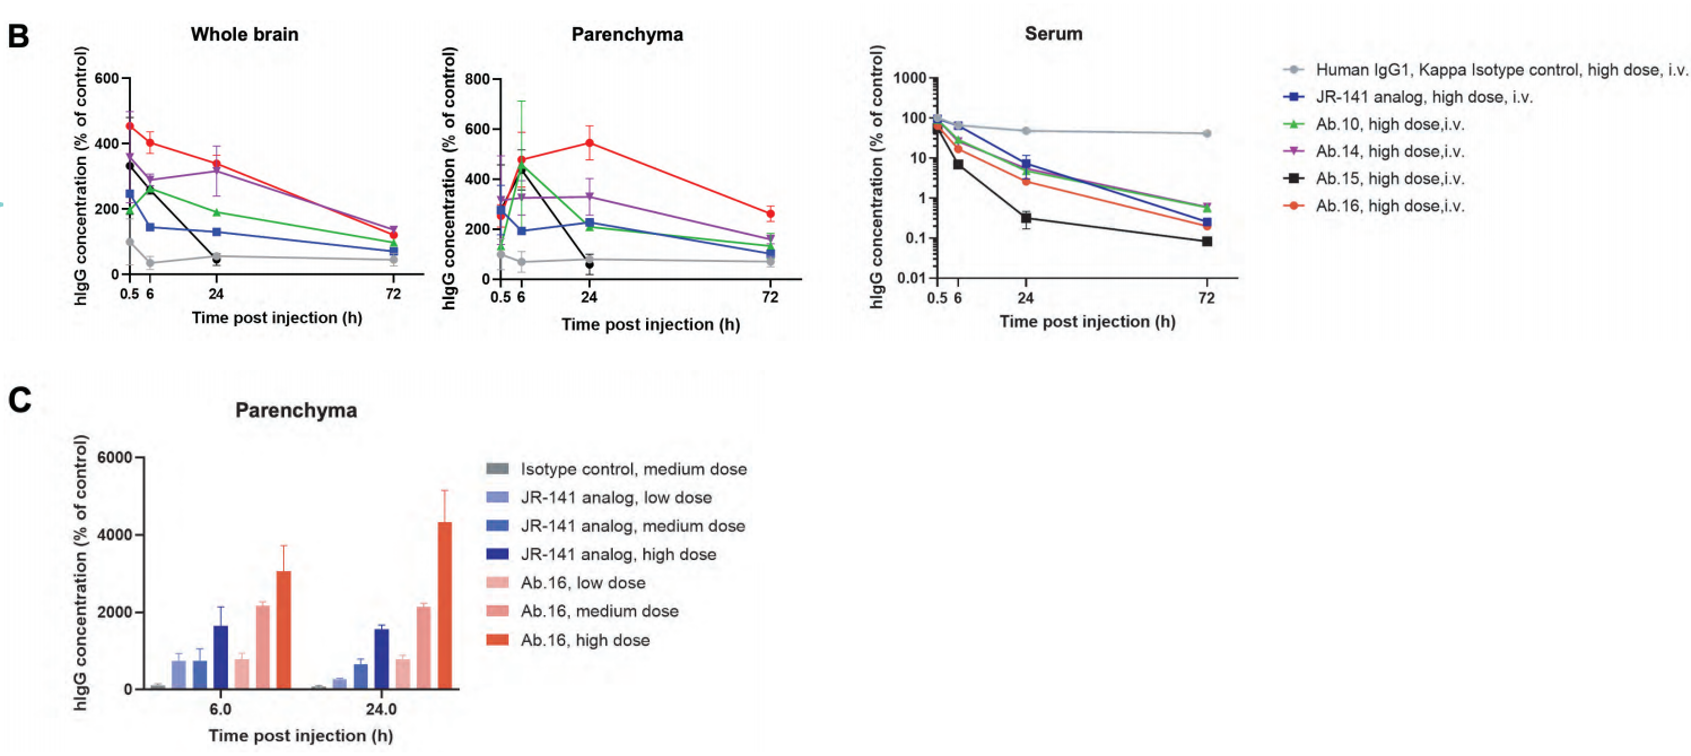
(B) hlgG concentration in total fraction (whole brain), top fraction (parenchyma) and serum was detected by electrochemiluminescence (Meso Scale Discovery). For each plot, the Yaxis was molar concentration and standard-ized relative to isotype control at 0.5 h. (C) hlgG concentration in parenchyma exhibited a dose-dependent trend. For most conditions, Ab.16 concentration was significantly higher than JR-141 analog. Low medium and high does respectively referred to 1,3,10 mg/kg for HCAbs, and the same molar dose for isotype control or JR-141analog. (D) lmmunofluorescence for hlgG
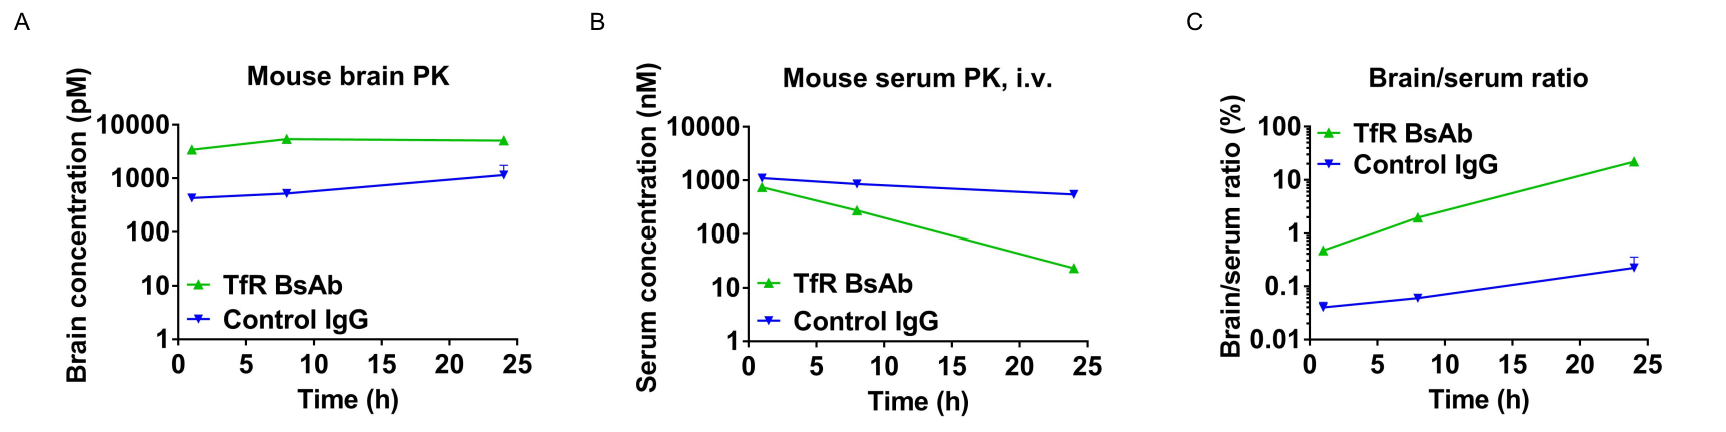
In vivo pharmacokinetic (PK) evaluation of anti-human TFR1 bispecific antibodies (BsAbs). TFR1 humanized mice were injected with control IgG (10 mpk) and anti-human TFR1 BsAbs (10.9 mpk) provided by a client via tail vein. Brain and serum were taken for in vivo PK evaluation. Brain concentrations (A), serum concentrations (B), and brain-to-serum ratio (C) of anti-human TFR1 BsAbs were quantified. As shown in panel, anti-human TFR1 BsAbs exhibited higher serum clearance and enhanced brain exposure after dose. The results confirmed that brain of TFR1 humanized mice enables uptake of an intravenously administered anti-human TFR1 BsAbs and TFR1 humanized mice provide a powerful preclinical model for in vivo evaluation of effective delivery of protein therapeutics to the central nervous system (CNS). Graphs represent mean ± SEM.
Note: This experiment was performed by the client using TFR1 humanized mice. All the other materials were provided by the client.
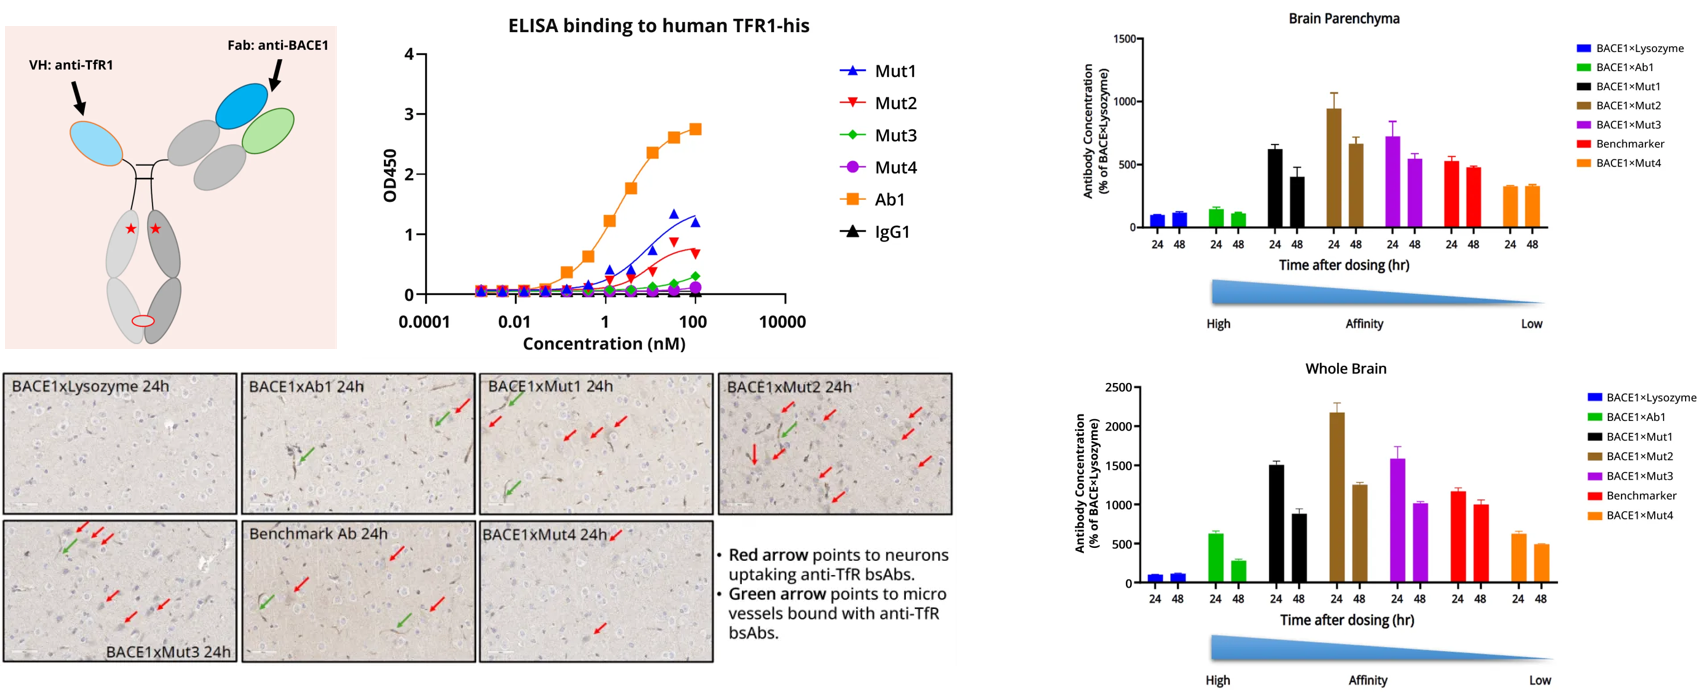
The evaluation of neuronal uptake, brain parenchymal distribution, and blood-brain barrier penetration function in human TFR1 gene knock in mouse model showed that BACE1×TfR1 bispecific antibody exhibited comparable or even better performance than the control antibody, with significant advantages in targeting and penetration.
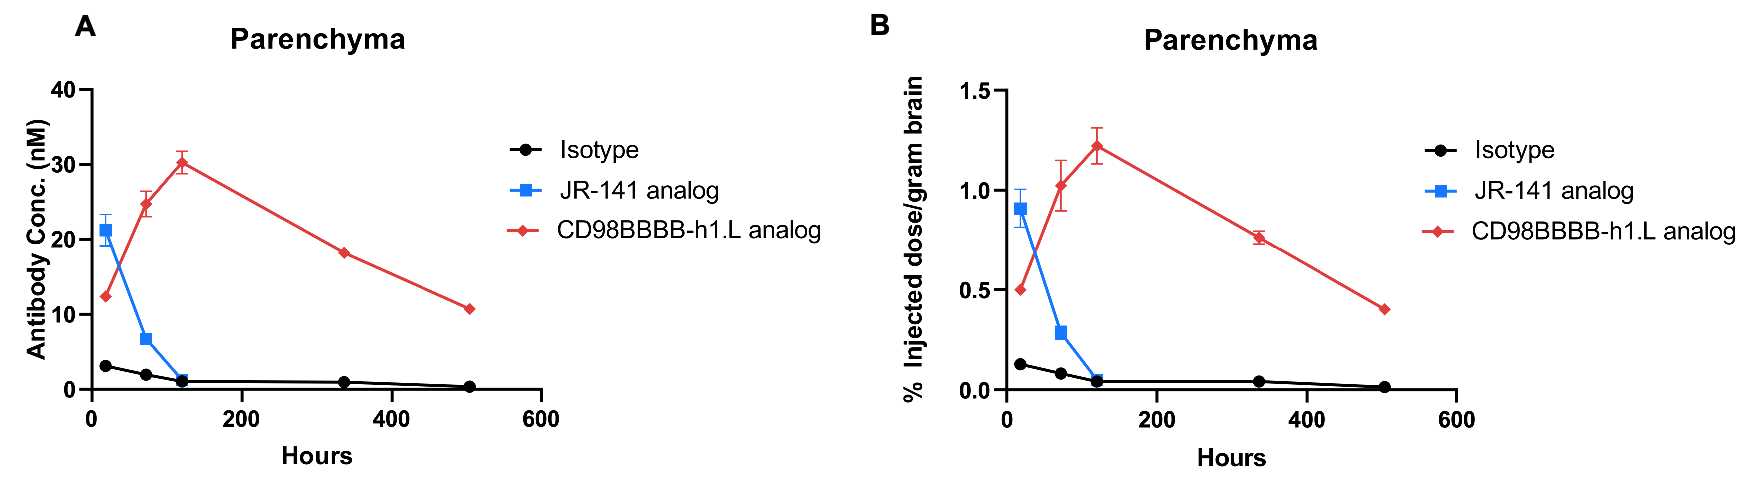
In vivo PK evaluation and comparison of anti-human TFR1 and anti-CD98HC antibody. B-hTFR1/hCD98HC mice (n=2, female, 8-week-old) were injected with control IgG (10 mpk) anti-human TFR1 antibody (JR-141 analog, monovalent, produced in house, 12.56 mpk) and anti-human CD98HC antibody (CD98BBBB-h1.L analog, monovalent, produced in house, 13.3 mpk) via tail vein. Brain were taken for in vivo PK evaluation. Brain concentrations (A) and % of injection/gram brain (B) were quantified. As shown in panel, anti-human TFR1 antibody exhibited higher brain exposure in 24 h after dose, while anti-CD98HC antibody exhibited higher brain exposure in 72 h after dose. The results confirmed that B-hTFR1/hCD98HC mice enables uptake of an intravenously administered anti-human TFR1 antibody or anti-human CD98HC antibody, and this mice can be used for the comparison of penetration efficacy of shuttle molecules targeting TFR1 or CD98HC. Graphs represent mean ± SEM.
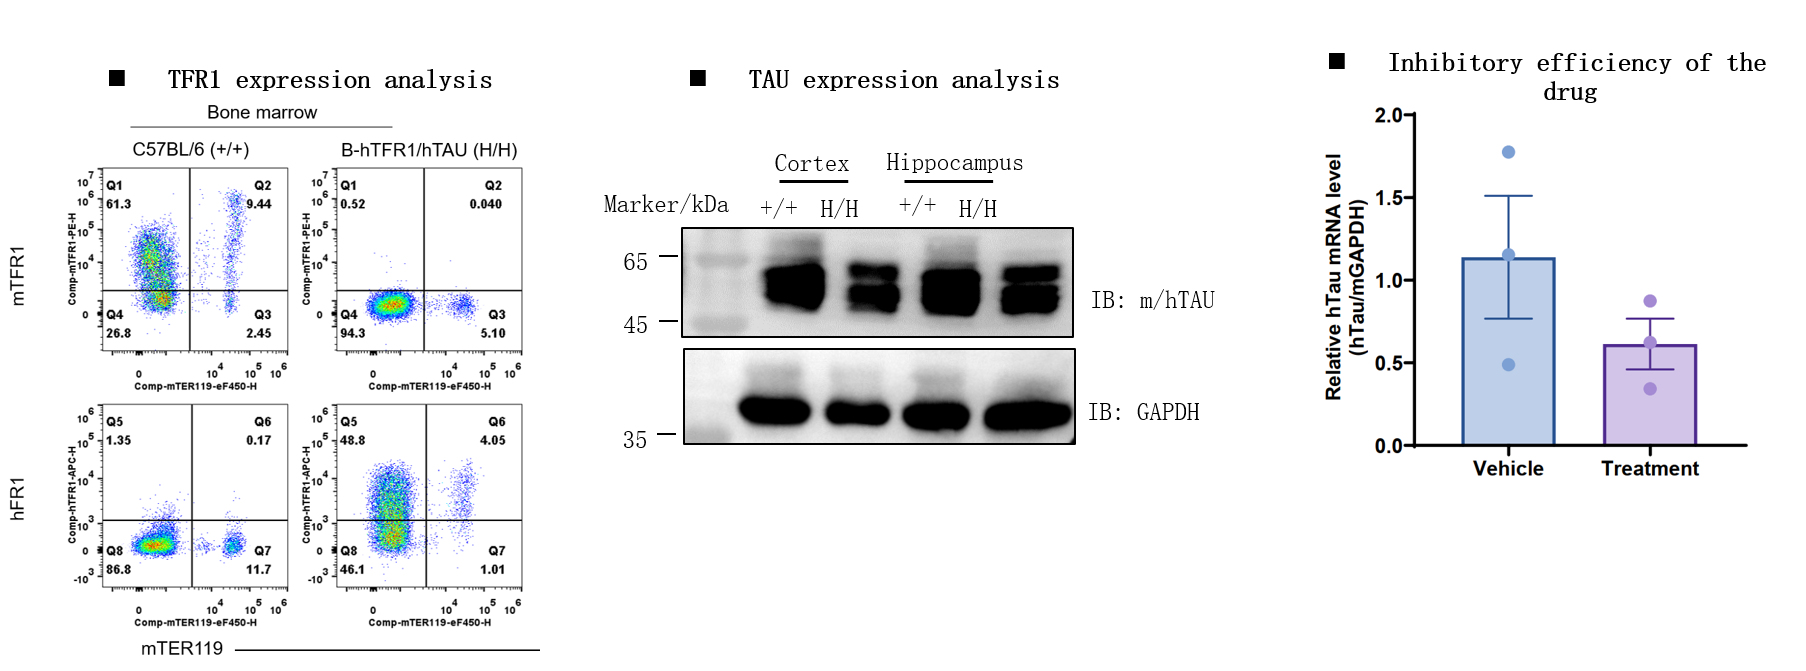
B-hTFR1/hTAU Mice: Gene Targeting Strategy
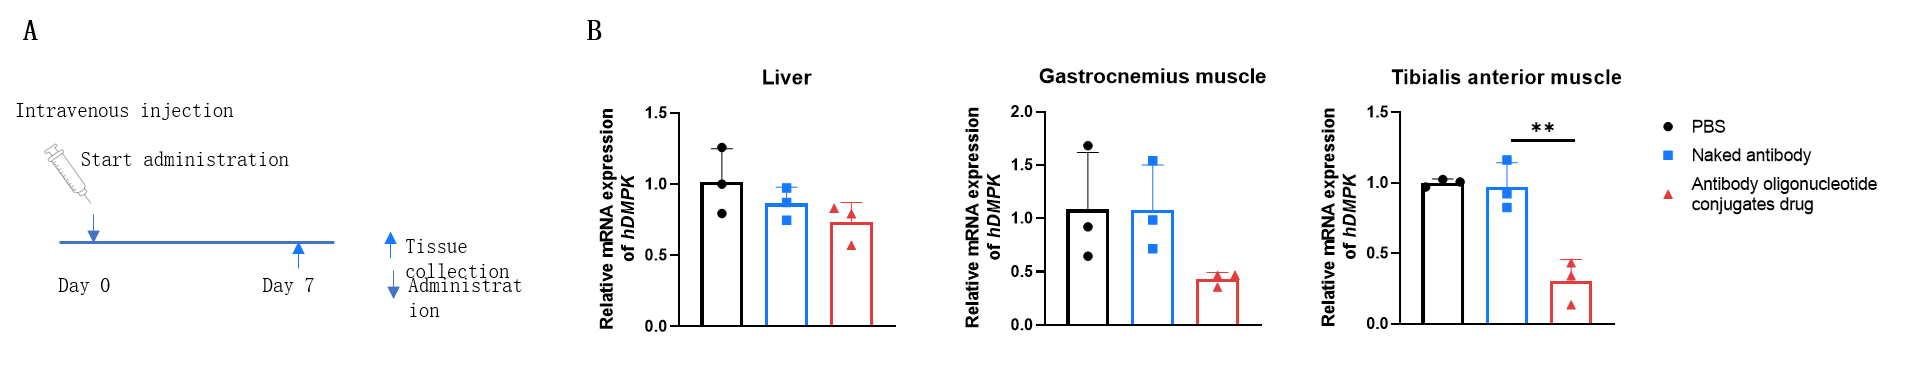
The inhibitory efficiency of the antibody oligonucleotide conjugates drug against human DMPK in heterozygous B-hTFR1/hDMPK mice. The antibody oligonucleotide conjugates drug (3 mpk, produced in-house), naked antibody (3 mpk, produced in-house) and PBS were administered to the heterozygous B-hTFR1/hDMPK mice individually on day 0. The mice were sacrificed on day 7, and the liver, gastrocnemius muscle and tibialis anterior muscle were collected to detect the expression level of human DMPK mRNA by qPCR. The human DMPK mRNA in the treatment groups (antibody oligonucleotide conjugates drug) were significantly reduced compared to the control groups (naked antibody and PBS) in tibialis anterior muscle, demonstrating that B-hTFR1/hDMPK mice provide a powerful preclinical model for in vivo evaluation of human DMPK targeted antibody oligonucleotide conjugates drug. Values are expressed as mean ± SEM.